
![]() This user guide should help to clear up any questions about how to use the Assistant Coach application. The intended audience for the app is football coaches (mostly high school and small colleges) and perhaps football enthusiasts or statisticians (although the math here is very basic).
This user guide should help to clear up any questions about how to use the Assistant Coach application. The intended audience for the app is football coaches (mostly high school and small colleges) and perhaps football enthusiasts or statisticians (although the math here is very basic).
Below I will go through all of the screens in the application, explaining what each user input does, and what the effect will be.
Version Note: I’m in the process of publishing a new version of the Assistant Coach application. I’ve added new roster and field diagram features, and I have simplified the interface for the 4th Down Calculator. Previously it was set up for multiple team profiles, but I have removed that. The app will continue forward with only a single team profile. If you currently have multiple profiles, you should delete all but one. Otherwise the new version of the app will choose one at random and ignore the others. Sorry for the inconvenience, but I’m hoping that one profile is just fine for most purposes.
Note about the 4th Down Calculator: The calculations here represent expected, or average, outcomes. The data come from, and will be most useful in, scenarios in the early-middle stages when the game clock is still not a factor. Many adjustments need to be made as time starts to run out (in either half). The calculations might still be helpful as a general guide, but it won’t adjust for factors such as being down by 4 points with one minute left in the game (when a field goal would be essentially useless) and so on.
Contents
Main Screen
Team Roster
Add/Edit Player
Formations
Add/Edit Formation
Charts
Net Punt Distance
Field Goal Percentage
Fourth Down Conversion Rate Inside 10-Yard Line
Fourth Down Conversion Rate Between 11 and 20-Yard Lines
Fourth Down Conversion Rate Beyond The 20-Yard Line
Expected Points (EP)
4th Down Calculator
4th Down Calculator Results
Main Screen
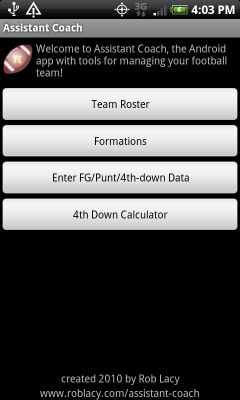
This is the main screen for the Assistant Coach app, with four choices:
Team Roster: This is for editing your team roster. You can add players and edit or remove existing players.
Formations: These are visual diagrams of players on the field on offense, defense and special teams. You can assign players to positions and you can drag positions around to create any formation you’d like. The app will start you off with a set of default formations. You can customize them as well as add new formations and delete existing ones.
Enter FG/Punt/4th-down Data: This is the data entry half of the 4th Down Calculator. Here you enter all of the background data to perform the calculation. If this is your first time setting this up, the data will default to the profile of an average NFL team from data gathered over the past few seasons.
4th Down Calculator: After you have entered the above data, you can select the “4th Down Calculator” to find out the optimal decision for a 4th down at any point on the field (for example: should you go for it on 4th and 7 from your opponent’s 35 yard line?).
Team Roster
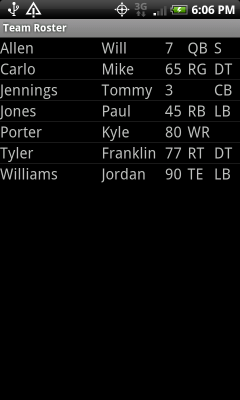
Here you will be able to view and edit your team’s roster of players. From left to right, the columns are: Last Name, First Name, Jersey Number, Position on Offense, Position on Defense. The app allows players to be given separate positions on offense and defense, but both are optional. Use the phone’s menu button to show an option to add a new player.
Add/Edit Player
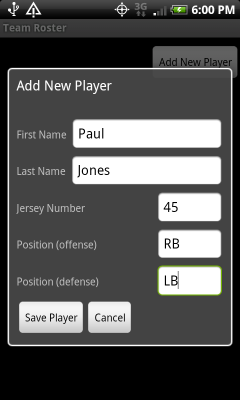
This is the data entry screen to add a new player to the roster or to edit an existing player. Type in the player’s information and press “Save Player” to save your changes. If you are editing an existing player, you can press “Delete Player” to permanently delete the player from the application. If the player was already assigned to any locations on a field diagram, they will be cleared out.
Formations
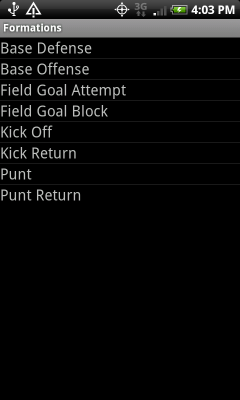
The formations menu shows the list of existing formations. Press one to view the visual layout on the field and assign players. Long press to edit the name or type of the formation and to delete it. Use the phone’s menu button to add a new formation.
The app starts with a default set of formations: offense, defense, kick off, kick return, punt, punt return, field goal attempt, and field goal block. The layout of each formation is just a random starting value and you should drag positions on the field to match whatever specific formation you wish.
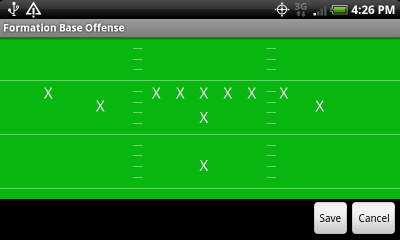
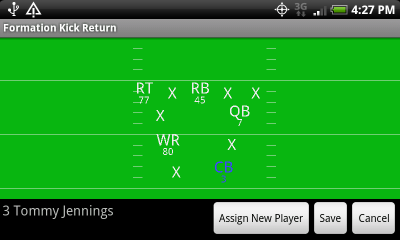
When you first look at the visual layout of a formation, all locations will be represented by an “X”. Tapping on an X will bring up the “Assign New Player” button which will allow you to select a player from your roster to be at that location on the field.
Players are allowed to have separate positions for offense and defense. The position shown in a diagram will depend on whether you are looking at the offense or defense. For special teams it will show the player’s offense position if possible, falling back to the player’s defense position if there is none selected for offense. For example, if a player is a TE on offense and a LB on defense, his position on the diagram will be TE for offense and special teams and LB for the defense diagram.
Be sure to press “Save” after you have made some changes. All changes will be lost if you cancel or go back without saving first.
Add/Edit Formation
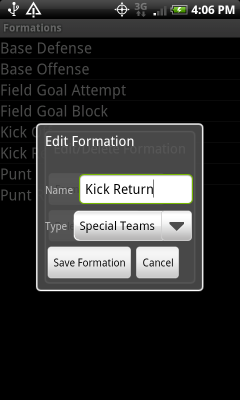
Here you assign the name of a formation and the type. The type of the formation determines which position types will be used in the player labels. Offense formations will use offense positions, defense will use defense positions, and special teams formations will use offense unless it is blank, in which case it will fall back to defense. Formations like punt and field goal are probably better as type=Offense because most players (like linemen) will be playing their usual offense position in these cases. Similarly, punt returns and field goal blocks should have type=Defense.
Charts
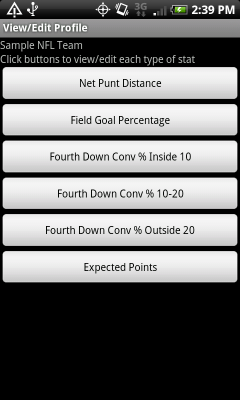
There are six screens to view/edit different aspects of data needed by the 4th Down Calculator. They all have the same basic interface, showing a visual chart with yard lines along the X axis. Tap and drag the red dots up and down to adjust values. The currently selected dot will be highlighted and you can use the arrow buttons to make fine-tuned adjustments. When you are finished, click “Save” or click “Cancel” to discard changes and go back to the previous screen.
The lighter-shade arrow on the chart points to the left to indicate the direction the offense is moving down the field. For example, in the Net Punt Distance chart below, the highlighted dot is on the opponent’s 40-yard line, with an average net punt distance of 26.6 yards (meaning the opponent would get the ball at their own 13.4-yard line).
The 0-yard lines should be treated as the “1-inch” line at either end of the field.
Note: For several data sets you can only edit values for every 5 yard lines, and the values in between will be automatically calculated to form a straight line. I hope this is enough detail for most uses. I coded it that way to make this screen easier to use. In a future version of the app I will allow for more detailed data input.
Net Punt Distance
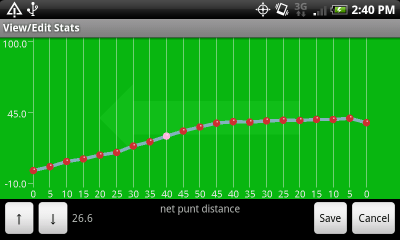
This chart shows net punt distance from the line of scrimmage at each point along the field. The range of possible values goes from -10.0 to + 100.0 and I don’t perform any error-checking (so you could set the average punt from the 50-yard line to 100 yards, and the app would allow it).
The chart includes parts of the field where no team would realistically punt. These can be ignored, or you can set whatever values you like here.
Field Goal Percentage
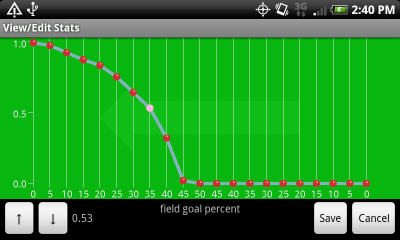
This chart shows the chances of making a field goal from the line of scrimmage at each point along the field. The range of possible values goes from 0.0 to 1.0.
Fourth Down Conversion Rate Inside 10-Yard Line
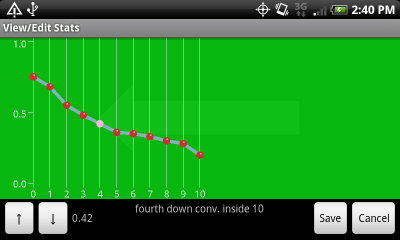
This chart shows the chances of converting a fourth-down try inside the opponent’s 10-yard line for each of the given to-go distances. The X-axis values on this chart represent to-go distances, not actual yard lines. So the value at x=6 represents fourth down and 6 yards to go, but could be at the 6, 7, 8, 9, or 10-yard line. The range of possible values goes from 0.0 to 1.0.
Fourth Down Conversion Rate Between 11 and 20-Yard Lines
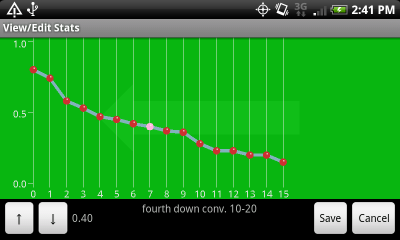
This chart shows the chances of converting a fourth-down try between the opponent’s 11-yard line and their 20-yard line for each of the given to-go distances. The X-axis values on this chart represent to-go distances, not actual yard lines. The chart goes out to fourth down and 15 yards to go. Beyond 15 yards, the odds of a successful conversion are generally pretty close to zero, but let me know if you think the app should expand to 20 or even 25 yards here. The range of possible values goes from 0.0 to 1.0.
Fourth Down Conversion Rate Beyond The 20-Yard Line
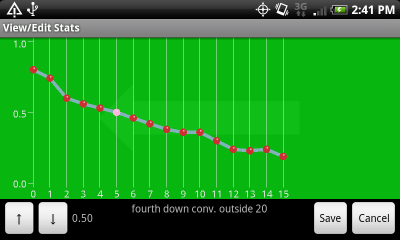
This chart shows the chances of converting a fourth-down try outside the opponent’s 20-yard line for each of the given to-go distances. The X-axis values on this chart represent to-go distances, not actual yard lines. The chart goes out to fourth down and 15 yards to go. Beyond 15 yards, the odds of a successful conversion are generally pretty close to zero, but let me know if you think the app should expand to 20 or even 25 yards here. The range of possible values goes from 0.0 to 1.0.
Expected Points (EP)
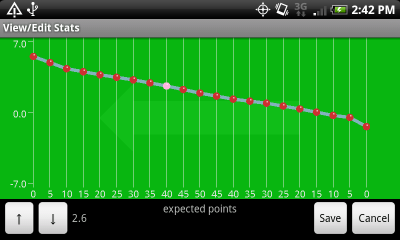
This chart shows expected points for each yard line on the field. Expected Points is the average number of points a team scores after having a first down at the given point on the field. For more detailed information, check out this explanation from Advanced NFL Stats.
The app uses this data for both your team and your opponent. For example, if you are deciding whether to go for it on fourth down and one at your opponent’s 27-yard line, the app will make use of EP for success (a first down at your opponent’s 26-yard line) and failure (your opponenet getting a first down at their own 27-yard line) when coming up with the final calculation. A future version of the app might have separate charts for the opponent’s EP values.
Note: A 100% chance of scoring a touchdown does not usually correspond to an EP value of 7 because the resulting kick-off is also taken into account. The app currently assumes that a kick-off results in the opposing team getting a first down on their own 30-yard line (the NFL average is around the 29 – in a future version of app I will make this configurable) which will have its own EP value. In my sample NFL data, the EP of having the ball at the 30-yard line is 0.9 so the result of scoring a touchdown is 7 (assuming an 1-pt conversion) actual points and giving up 0.9 expected points to your opponent. Therefore a 100% chance of scoring a touchdown would have an EP of 6.1.
4th Down Calculator
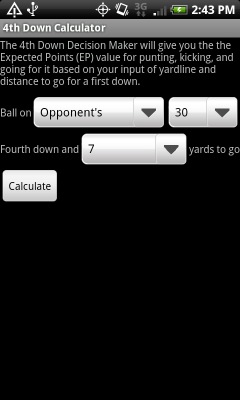
This screen is pretty self-explanatory. Choose your position on the field and yards to go, and click “Calculate” to see the expected points calculations for punting, attempting a field goal, and going for it. Before using this screen, make sure you have selected and edited your team profile so the data is accurate and relevant to your team and your current opponent.
4th Down Calculator Results
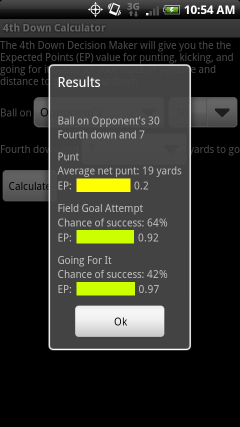
This screen shows the results for a single 4th-down calculation. It shows results for punting, attempting a field goal, and going for it. The first line in each section shows the value from the corresponding data screen, and the second line shows the expected points for the action. The colored bar gives a visual interpretation of expected points, with red being bad and green being good. The width of the bar also corresponds to the value. A very narrow bar corresponds to a bad (negative) EP value, and a wide bar corresponds to a good value.